Cyclistic
Cyclistic Case study
This case study is my analysis of the Cyclistic capstone project from the Google Data Analytics Professional Course using the member data in 2021. This capstone project includes:
- data cleaning/processing/analysis in Rstudio and Python 3.9,
- visualizations of the results in Tableau.
The target of this case study is to find a strategy to help Cyclistic, a bike share company based in Chicago, to maximize the number of annual memberships and increase their profit, using the historical data from the riders in 2021. The data contains the following information of each ride:
rideable_type: the type of bike used in this ride. There are three type of bikes:electric,classicalanddocked.started_atandended_at: the start and end time of this ride.member_casual: the type of customer.memberrepresents those have annual memberships, whilecasualrepresents customers do not hold memberships.
Note that start_station (start_station_id) and end_station (end_station_id) are not considered in this case study. But they could contain important reasons for customers choosing to be members, with mostly geographical reasons (e.g. customers live near stations far away from other transportations may choose to join memberships). For possible furture need of these information, we now only clean this data by double check the one-to-one pair of the station names and station id.
Data processing/cleaning (Rstudio)
- Check with missing values (No missing values and duplicates).
- Check with unreasonable categories in
member_casualandrideable_type(No extra categories found). - Compute time length for each rides (
hmspackage). - Compute the month and weekday of the start date in each rides (
lubridatepackage).
Visualizations and results
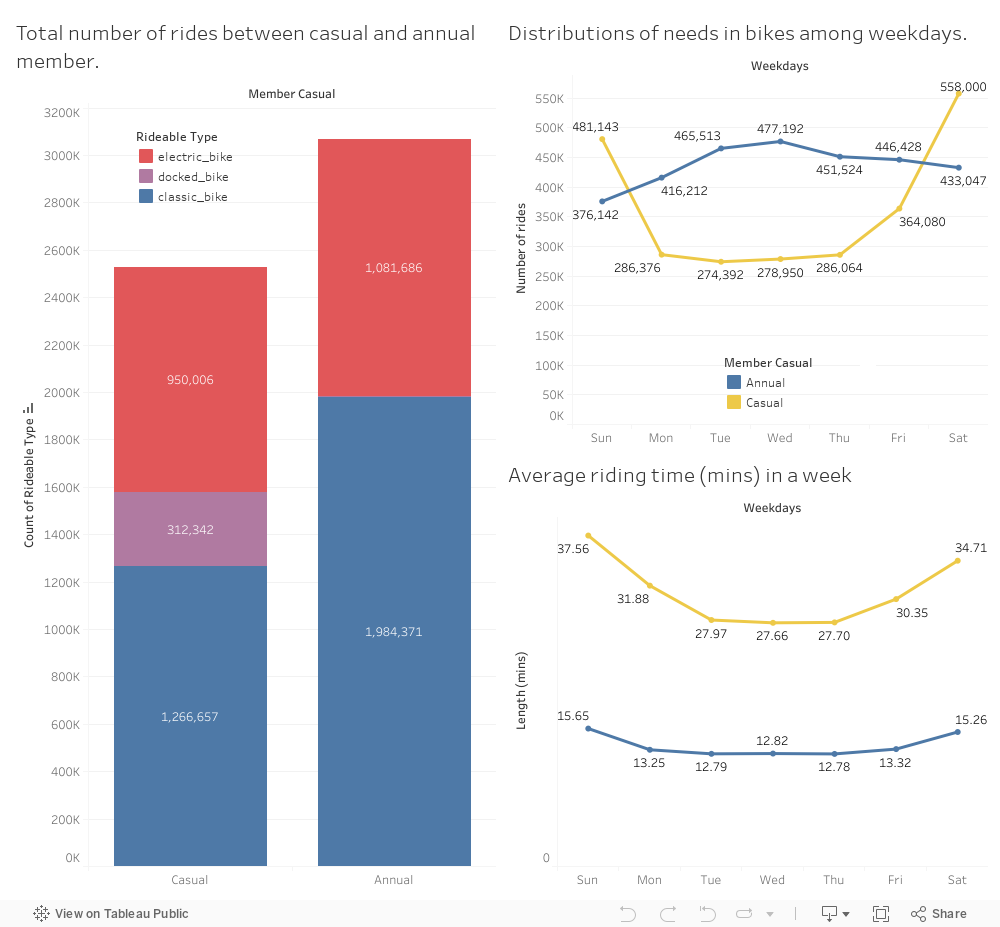
- Only casual customers use docked bike. The number of using electrical bike are similar, while there are more annual members use classical bike.
- From weekly distribution of rides, it is obvious that the numbers of usage in the bike in a week does not change very much among annual members. However, casual members tend to use bikes more likely during weekends.
- Also, surprisingly, casual members spend more time averagely, especially during weekends.
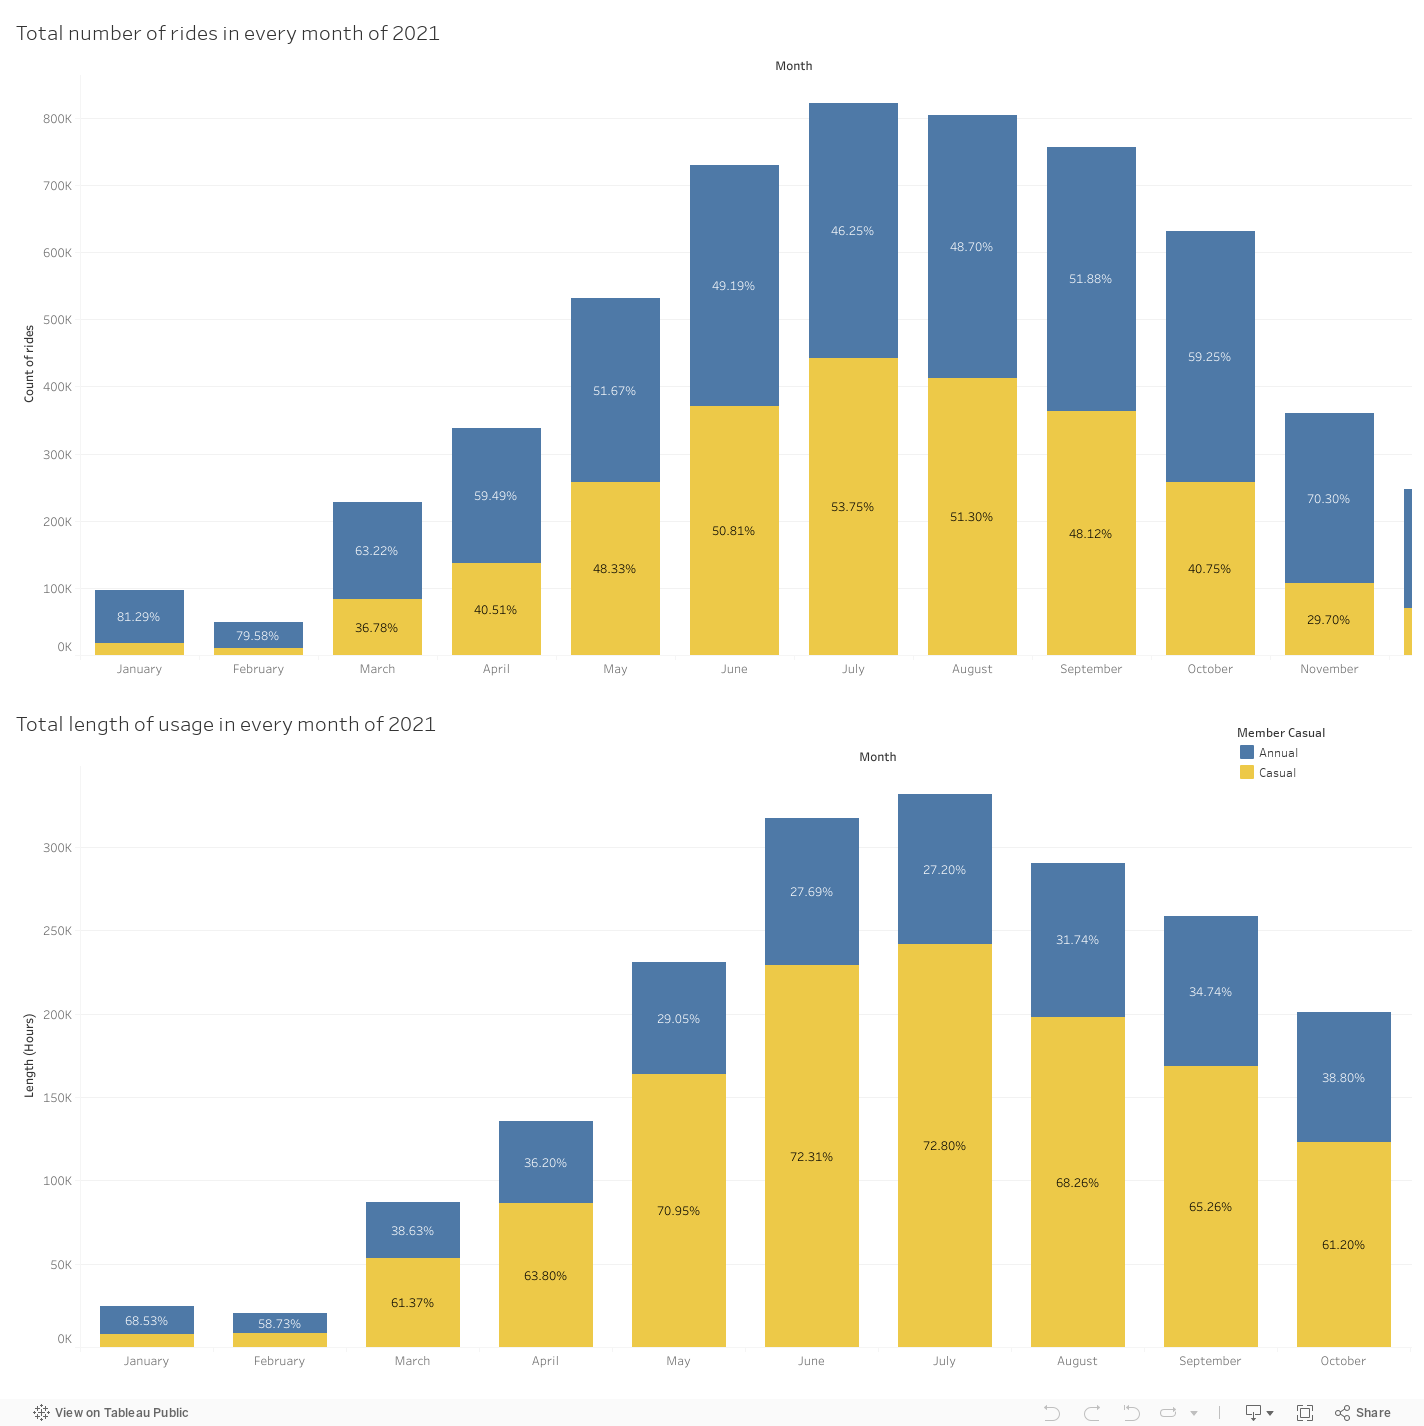
Moreover, to discover the trend of using bikes in 2021 in a monthly view, I aslo plot the number of rides in each month.
- The number of rides surges between May and October (half year).
- During summer time, percentage in the number of rides are similar between causal and annual members. About half number of total rides come from causal members.
- However, the length of using bikes for casual customers are more than 2 times as annual members during this period.
Strategy of increasing memberships
The behaviour of the customers can be summarized as following:
- Only causal members use docked bike.
- Causal members seems to use more during weekend, while annual members has daily requirement of using bikes.
- It is the peak period of usage during summer time from May to October, when the usage of bikes greatly increases. But only half of the customers have membership and casual customers tend to use bikes longer than annual members.
We could design such a membership strategy to help causal members to choose the best one that fits their needs:
- Offer a special need membership for docked bike.
- Offer family membership/weekend-time membership.
- Offer a half-year membership. (This is targeted for summer time from May to October).
- This could be also combined with a discount in the other half of the year.